Web Administration Dashboard
From RifidiWiki
Revision as of 23:17, 22 April 2015 by Manuel transcends (Talk | contribs)
Contents
Introduction
The Web Administration Dashboard enables users to manage, monitor and configure Rifidi Servers and Applications.
Provide web admin Dashboard example URL:
Server Management
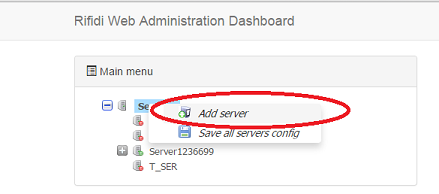
Add Server
- Right click on 'Servers' node and then choose 'Add server'
- Provide the values for attributes: Display name, IP address, protocol and port where rest services are deployed on that server.
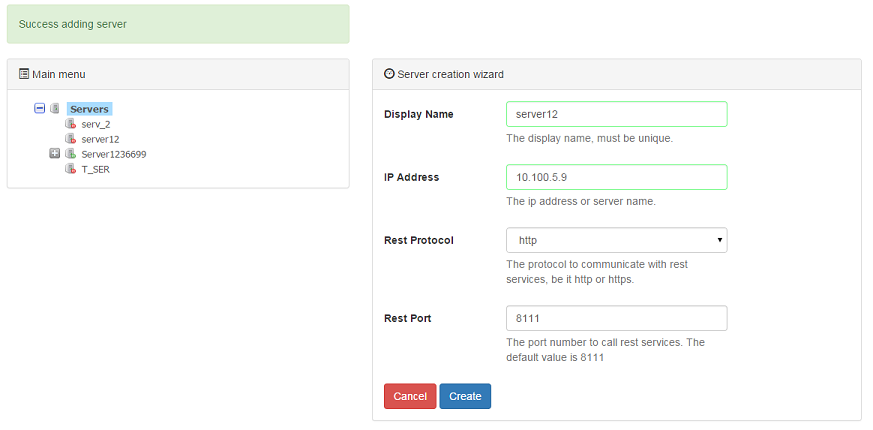
- When clicking 'Create' button, user is allowed to confirm that server creation. If creation is then confirmed by user, the application validates the server name to be unique, and if it is success, the server entry is created and displayed a success message on top of menu area. Once the server is created it will be displayed under 'Servers' menu node, and if it is able to connect to that server, the icon associated with that server turns in green color, otherwise it turns in red in case it is unable to connect to that server with supplied attributes.


The list of servers with associated connection attributes is stored in the server that serves the admin console, in a JSON file format.

Delete Server
Update Server Connection Properties
Get/Set Server JVM Configuration
Configure Primary/Secondary Nodes
Start Server
Stop Server
Configure logging
View/Filter logs
Monitor Server via Jolokia
leveraging edge monitoring Jolokia rest interface
Sensor Management
Sensor
Add Sensor Wizard
Steps user through creating sensor, session and command (where applicable).