Difference between revisions of "Web Administration Dashboard"
From RifidiWiki
(→Updated Command properties) |
(→Deleted Command) |
||
| Line 79: | Line 79: | ||
===Deleted Command=== | ===Deleted Command=== | ||
| + | # Right click on command node to delete and then choose 'Delete Command Template'<br>[[File:delete_command_link.png]] | ||
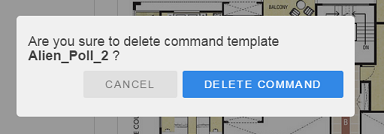
| + | # Confirm delete operation<br>[[File:delete_command_confirm.png]] | ||
| + | |||
===CReate Command=== | ===CReate Command=== | ||
===Execute Command=== | ===Execute Command=== | ||
Revision as of 06:04, 23 April 2015
Contents
- 1 Introduction
- 2 Server Management
- 2.1 Add Server
- 2.2 Delete Server
- 2.3 Update Server Connection Properties
- 2.4 Save Server Configuration
- 2.5 Save all servers Configuration
- 2.6 Get/Set Server JVM Configuration
- 2.7 Configure Primary/Secondary Nodes
- 2.8 Start Server
- 2.9 Stop Server
- 2.10 Configure logging
- 2.11 View/Filter logs
- 2.12 Monitor Server via Jolokia
- 3 Sensor Management
- 4 Application Management
Introduction
The Web Administration Dashboard enables users to manage, monitor and configure Rifidi Servers and Applications.
Provide web admin Dashboard example URL:
Server Management
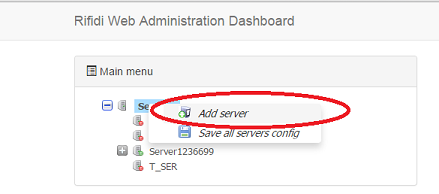
Add Server
- Right click on 'Servers' node and then choose 'Add server'
- Provide the values for attributes: Display name, IP address, protocol and port where rest services are deployed on that server.
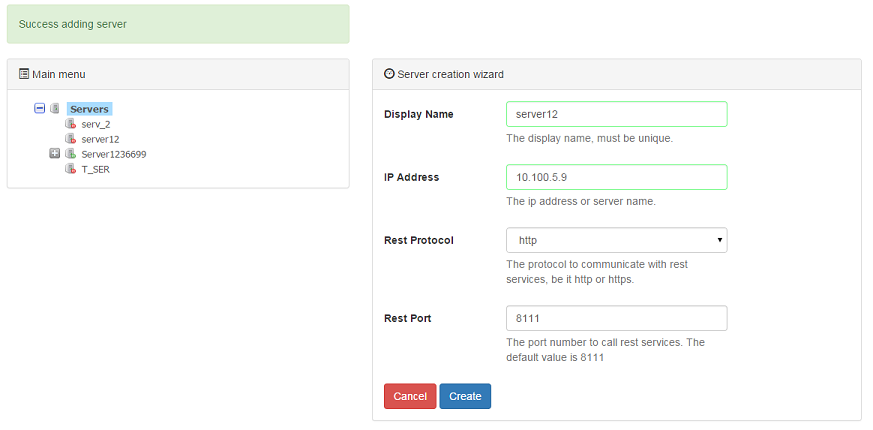
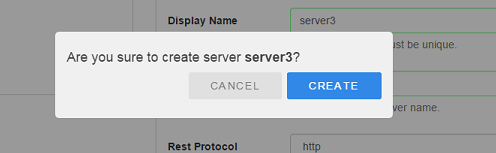
- Click on 'Create' button and confirm


Delete Server
- Right click on server node to delete and then choose 'Delete server'
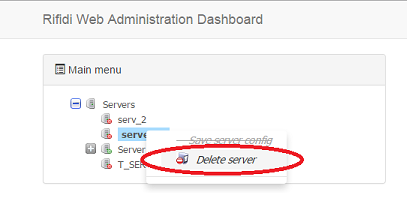
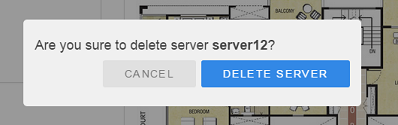
- Confirm delete operation


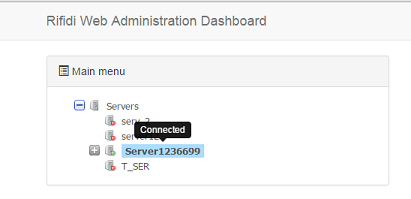
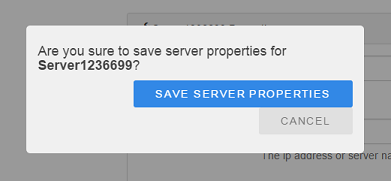
Update Server Connection Properties
- Click on server node to modify and then go to properties editor area
- Provide the values for attributes: Display name, IP address, protocol and port where rest services are deployed on that server.
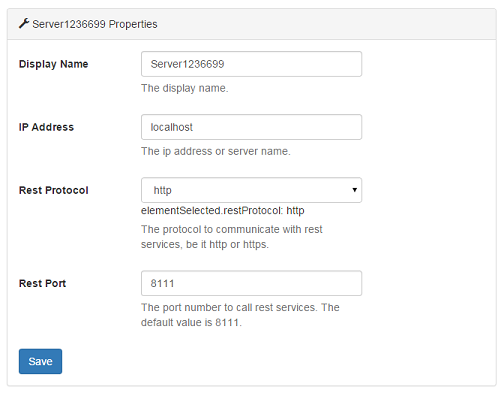
- Click on 'Save' button and confirm


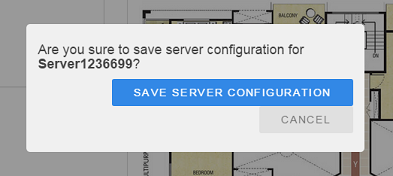
Save Server Configuration
- Right click on server node and then choose 'Save server config'
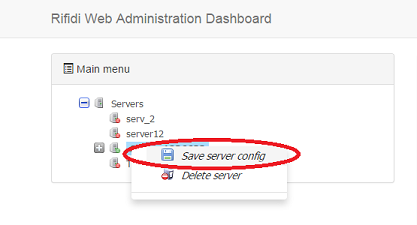
- Confirm the save operation


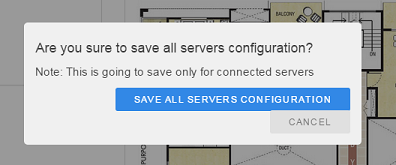
Save all servers Configuration
- Right click on "Servers" node and then choose 'Save all servers config'
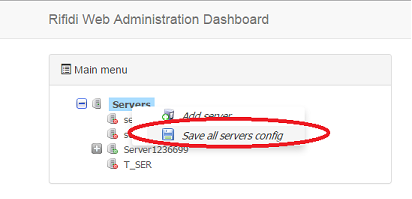
- Confirm the save operation


Get/Set Server JVM Configuration
Configure Primary/Secondary Nodes
Start Server
Stop Server
Configure logging
View/Filter logs
Monitor Server via Jolokia
leveraging edge monitoring Jolokia rest interface
Sensor Management
Sensor
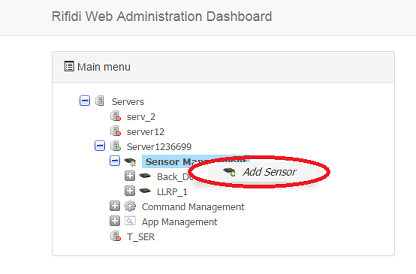
Add Sensor Wizard
Steps user through creating sensor, session and command (where applicable).
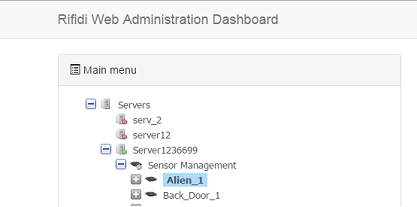
- Right click on 'Sensor Management' node and then choose 'Add Sensor'
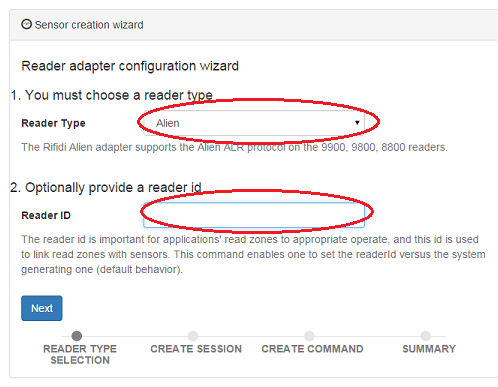
- Choose the sensor type and optionally provide the reader id and click Next
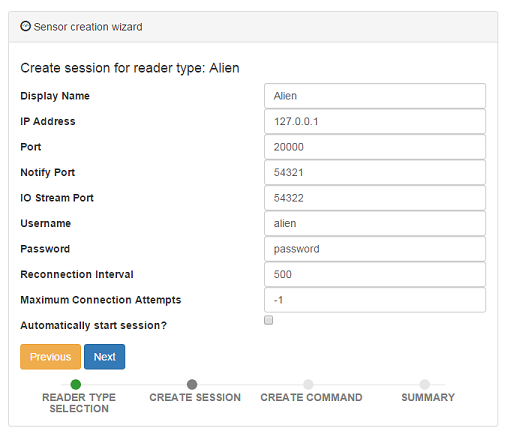
- Set the connection properties for sensor and optionally check if automatically start session, and click Next
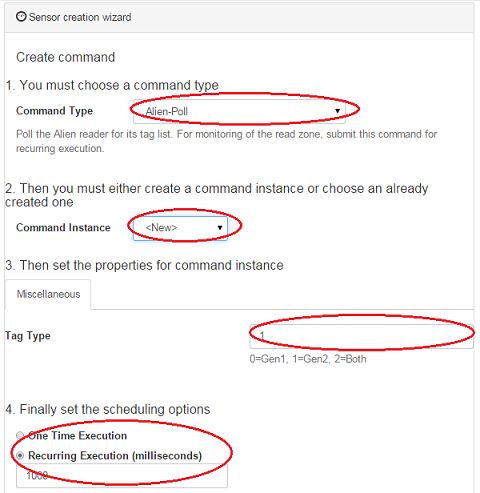
- Create the command for sensor, choose the command type and choose to create a new command instance or select an existing one, set the properties for command instance and set the scheduling options for executing command, and click Next
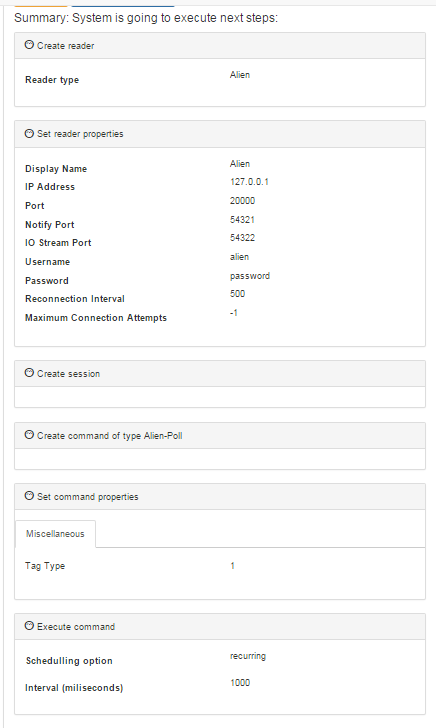
- Review steps summary and confirm


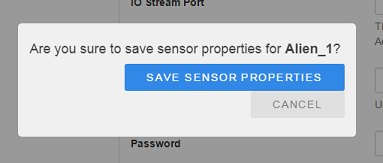
Updated Sensor Properties
- Click on sensor node to modify and then go to properties editor area
- Provide the values for sensor attributes
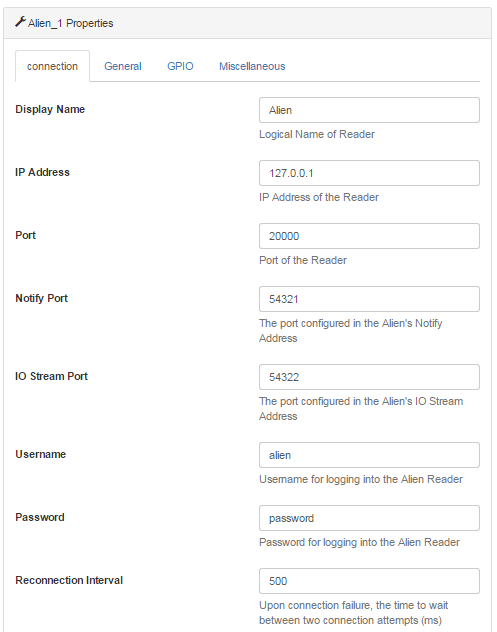
- Click on 'Save sensor properties' button and confirm


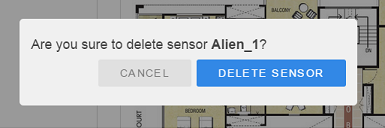
Delete Sensor
- Right click on sensor node to delete and then choose 'Delete Sensor'
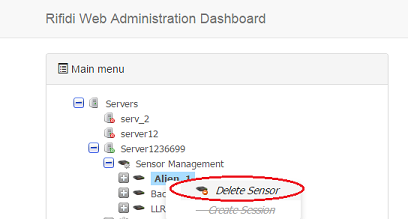
- Confirm delete operation


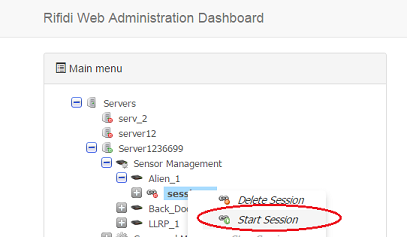
Session
Start Session
- Click on session node to start and then click on 'Start Session'

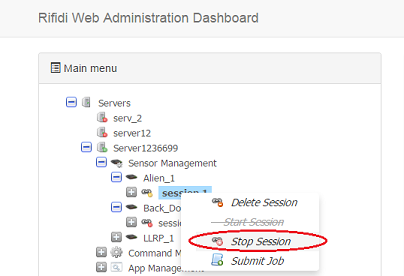
Stop Session
- Click on session node to stop and then click on 'Stop Session'

Commands
Updated Command properties
- Click on command instance node to modify and then go to properties editor area
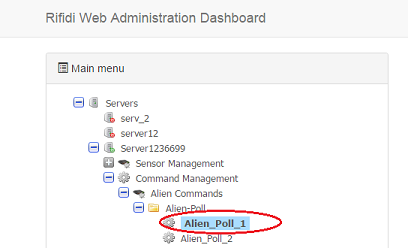
- Provide the values for command attributes
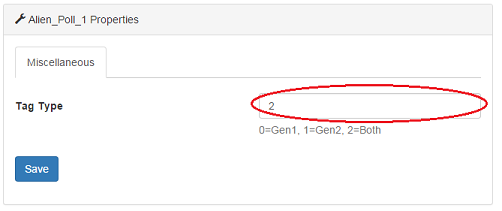
- Click on 'Save' button and confirm


Deleted Command
- Right click on command node to delete and then choose 'Delete Command Template'
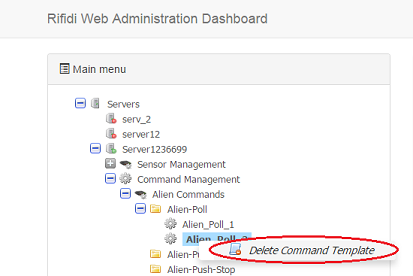
- Confirm delete operation